Regression Analysis
Method
Data from several sources were joined together into a merged dataset. We used data in 2017 to build the model. The main outcome is the suicide rate for each state, candidate predictors are gun, alcohol, temperature, precipitation, marijuana, education, GDP and gender for each state. We used stepwise approach to select a model.
| Predictor | Description |
|---|---|
| suicide | The number of suicide deaths per 100k population |
| gun | Averaged guns number per capita |
| alcohol | Alcohol consumption per capita (gallons of ethanol) |
| temperature | Average temperature (F) |
| precipitation | Average precipitation (inches) |
| marijuana | The proportion of people using marijuana (%) |
| education | Educational attainment - bachelor’s degree or higher (%) |
| gdp | GDP per capita (dollars) |
| gender | Male (%) |
Results
Scatter Plot
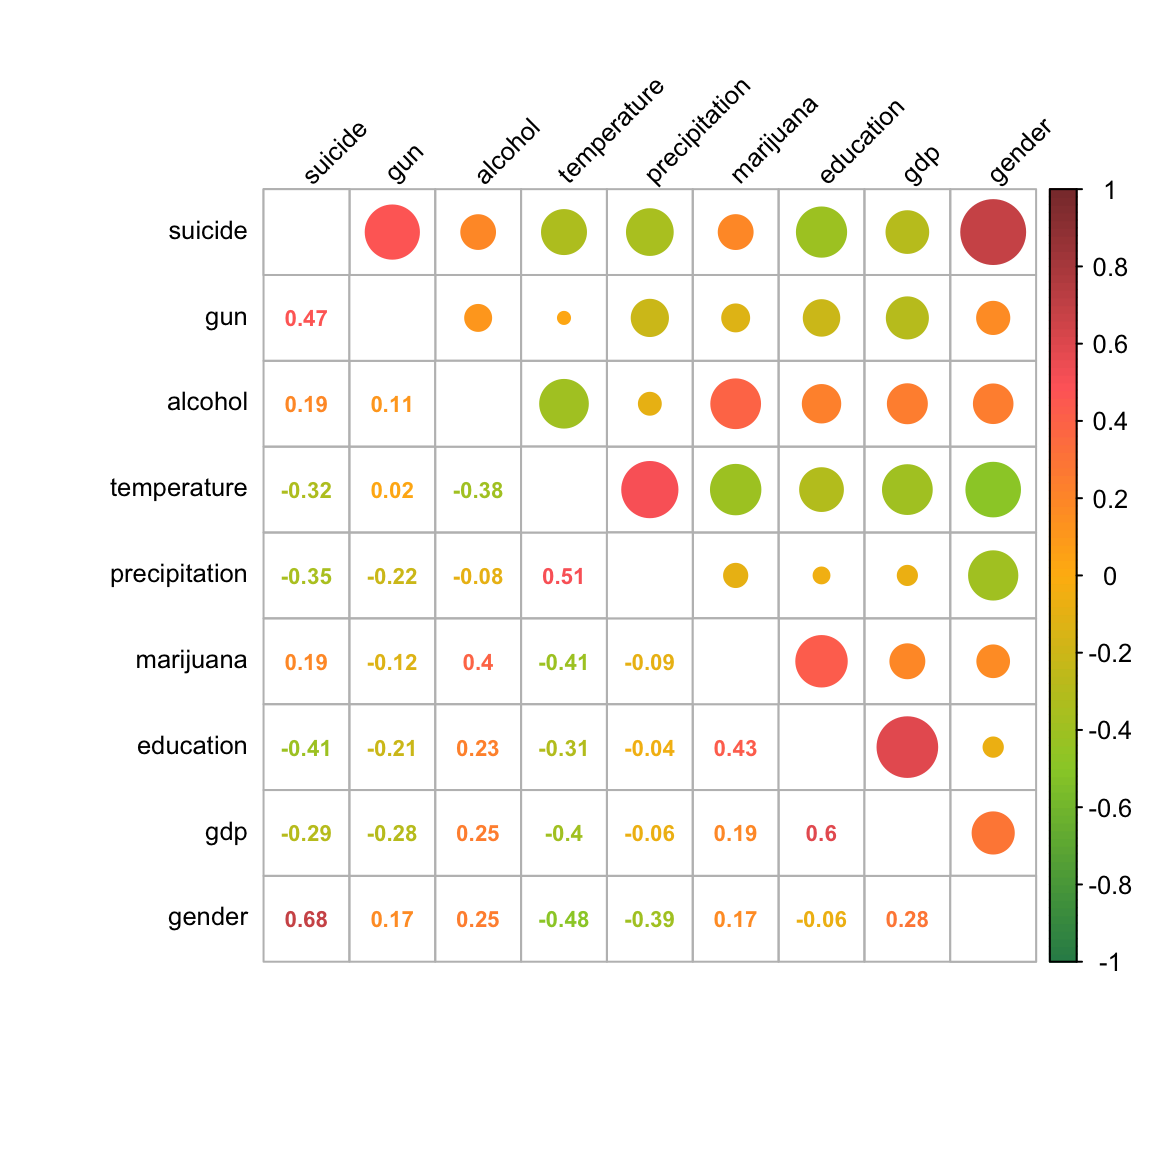
Correlation plot
Selected model of interest
| term | estimate | p.value |
|---|---|---|
| (Intercept) | -143.9870 | 0.0000 |
| gun | 0.1220 | 0.0007 |
| temperature | -0.0955 | 0.0502 |
| marijuana | 0.2485 | 0.0038 |
| education | -0.2343 | 0.0085 |
| gender | 3.5589 | 0.0000 |
| gdp | -0.0002 | 0.0004 |
| r.squared | adj.r.squared | AIC | BIC |
|---|---|---|---|
| 0.8354 | 0.8124 | 220.9604 | 236.2566 |
Visualize model coefficients
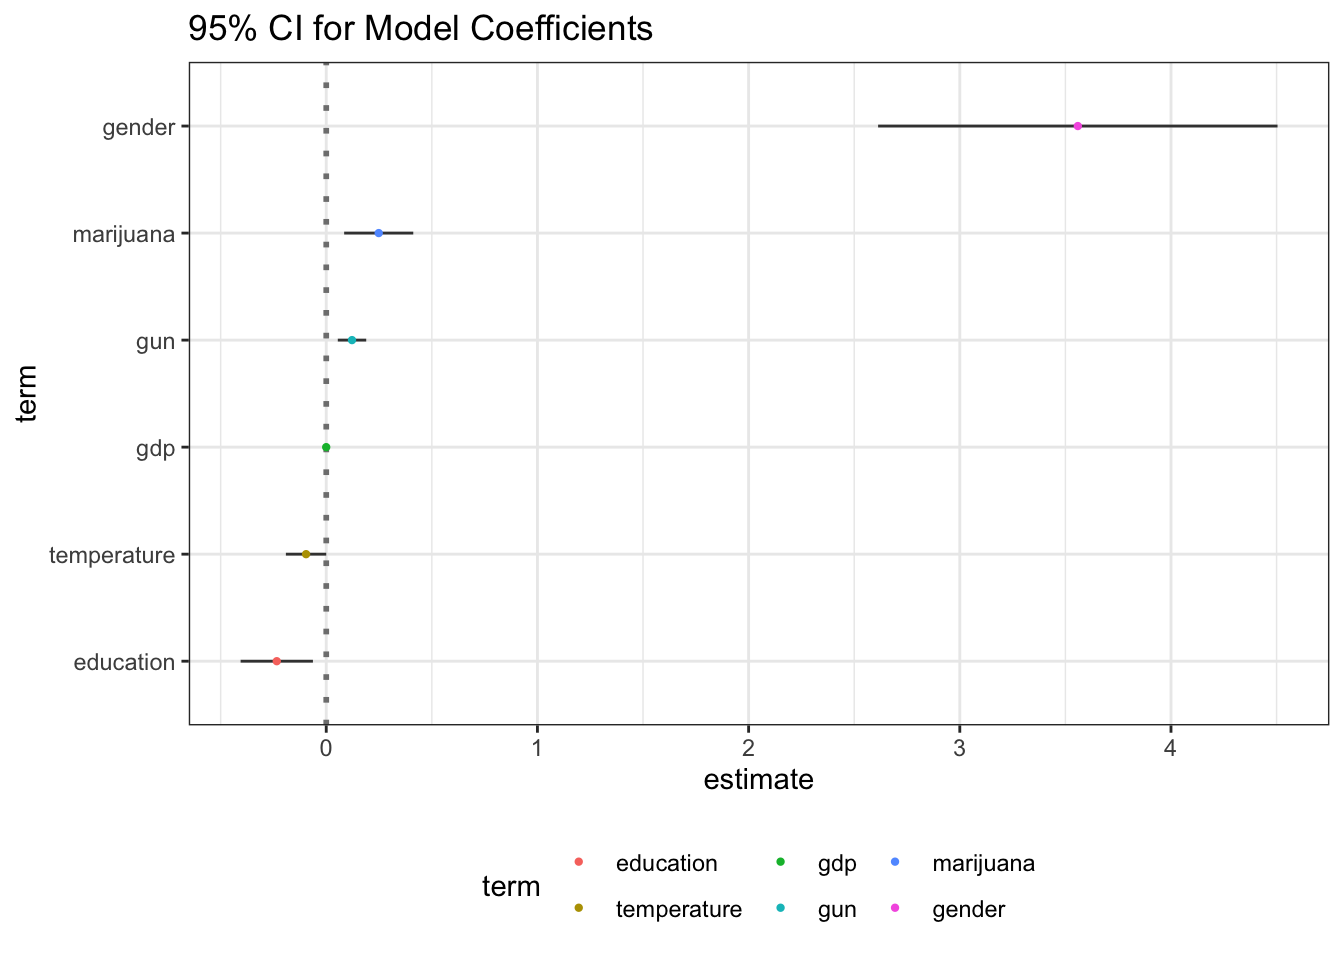
- The “alcohol” and “precipitation” were removed from the model.
- The fitted equation is “suicide = -143.99 + 0.12gun - 0.10temperature + 0.25marijuana - 0.23education + 3.56gender - 0.0002gdp”.
- Adjusted R-square is 0.8124, which means these variables can explain a large proportion of variance in the suicide rate.
- According to the results, the suicide rate is higher in states where there is a higher gun ownership rate, higher marijuana usage, higher ratio of males to females, lower temperature and lower educational attainment.
- Holding other variables constant, for one unit increase in gun ownership(per 1,000), marijuana use in adults(%), or for one unit decrease in proportion of male (%), GDP per capita (dollars), the suicide rate(per 100k population) will increase by 0.13, 0.27, 3.11 respectively, or decrease by 0.22, 0.0002 on average.