According to WHO, about 800,000 people died by suicide in 2016, of which 79% occurred in low- and middle-income countries. Overall, suicide accounts for 1.4% of all deaths worldwide, and has become the second leading cause of death among 15-29 age group.
World Suicide Change map
- In the time period, most countries’ suicide rates didn’t have dramatic changes.
- In Russia, an obvious change in the suicide rate can be observed. From 1990 to 1999, an increase was shown, as the color got lighter. From 2010-2016, there was a noticeable decrease, with heavier color showing up.
- The suicide rate in South American stayed in low position during 1985-2016
World Total Suicide Change
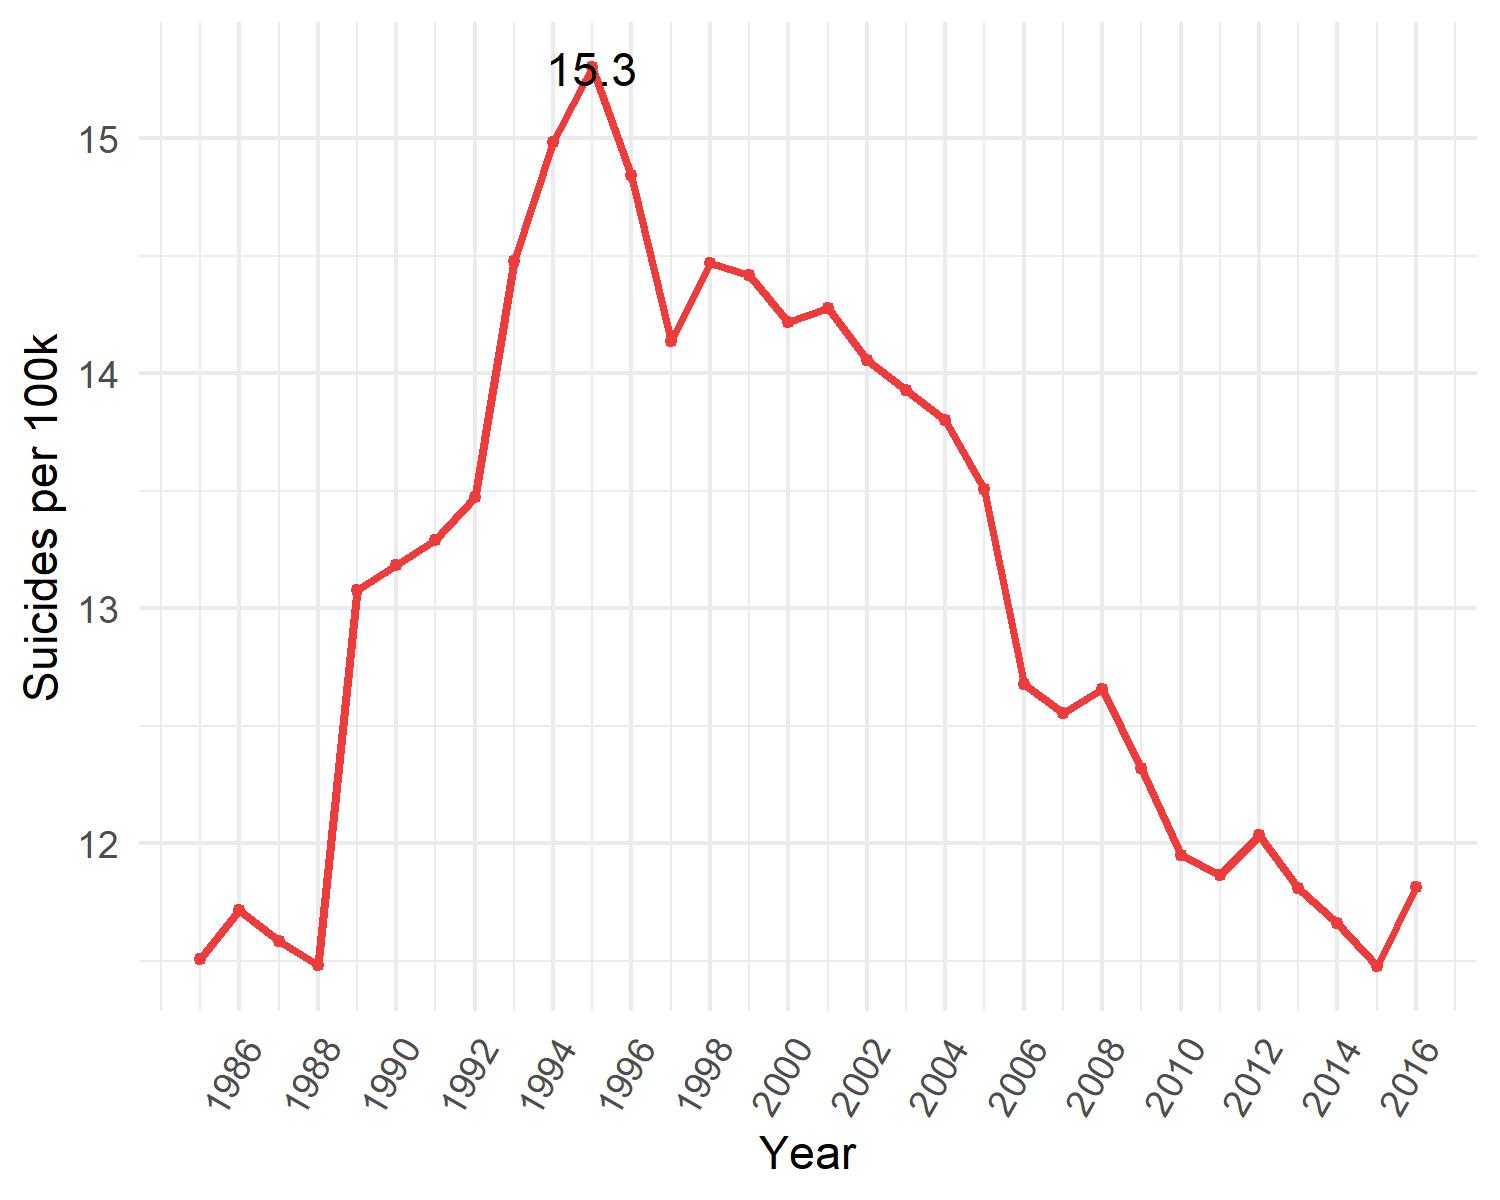
- From 1985-1995, the suicide rate soared dramatically, increasing by more 3 deaths per 100k population
- The peak was in 1995, 15.3 deaths per 100k people
- After 1995, an obvious and persistent decrease happened, with occasional rises in this period
World Total Suicide Change by Gender
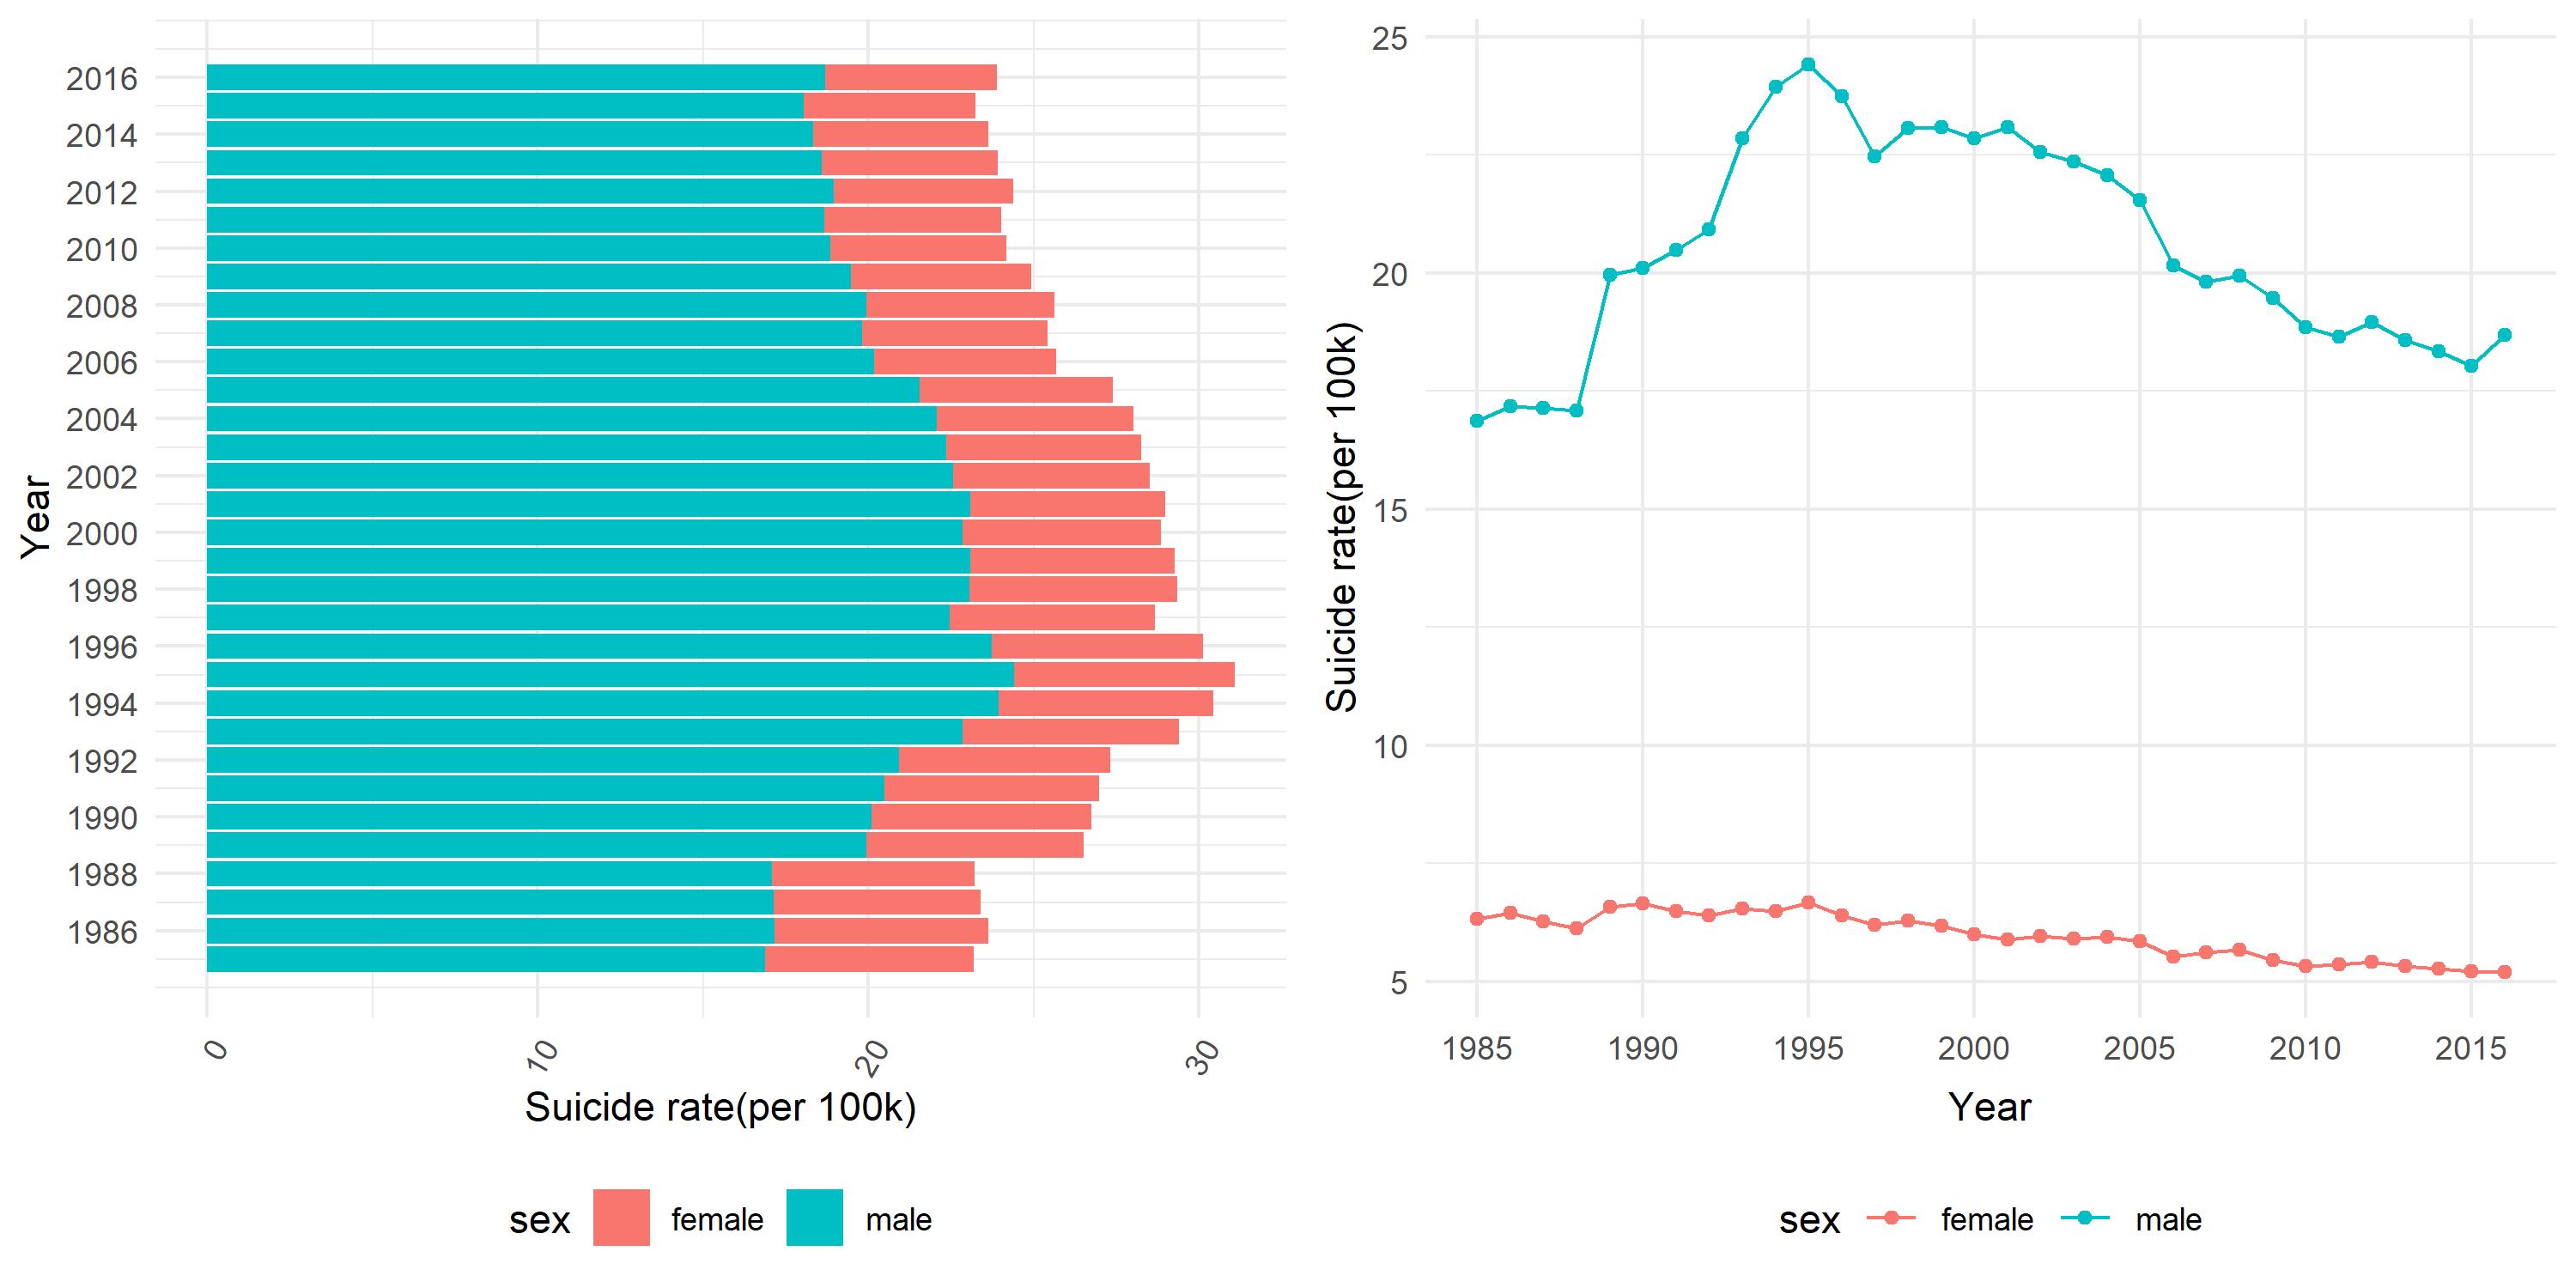
- In males, the suicide rate fluctuated a lot. From 1985-1995, the rate increased largely and peaked around 25 deaths per 100k in 1995. After 1996, a steady decrease occurred.
- In female, a very slight decrease was observed during the time
- The rate in male was about 3 times higher the than rate in female
World Total Suicide Change by Age
- Trends in 15-74 years were largely consistent.
- In the 75+ age group, the decrease happened all the time, from 30 death per 100k to 21 death per 100k.
- Generally, the 75+ group had the highest suicide rate, while 5-14 age group had the lowest rate all the time.
Average Suicide Rate Ranking by Country
Findings
- The country with the highest suicide rate is Lithuania, with more than 30 deaths per 100k population
- U.S. ranks around 23th, with around 15 deaths per 100k population, incicating a not optimistic situation